Pickleball Comparison: A Comparative Market Analysis: United States vs India (2026)
Pickleball, a hybrid sport combining elements of tennis, badminton, and table tennis, has transformed from a recreational pastime into a structured global sports industry within a decade. By 2026, the pickleball ecosystem presents two sharply contrasting yet strategically connected markets: a mature, capital-rich, and commercially optimized market in the United States, and a rapidly emerging, high-growth, adoption-driven market in India.
This article delivers a comparative, number-focused analysis of the pickleball markets in the United States and India across market size, participation, infrastructure, commercialization, investment dynamics, and long-term outlook—highlighting where scale dominates and where growth velocity creates opportunity.
Market Maturity and Economic Scale
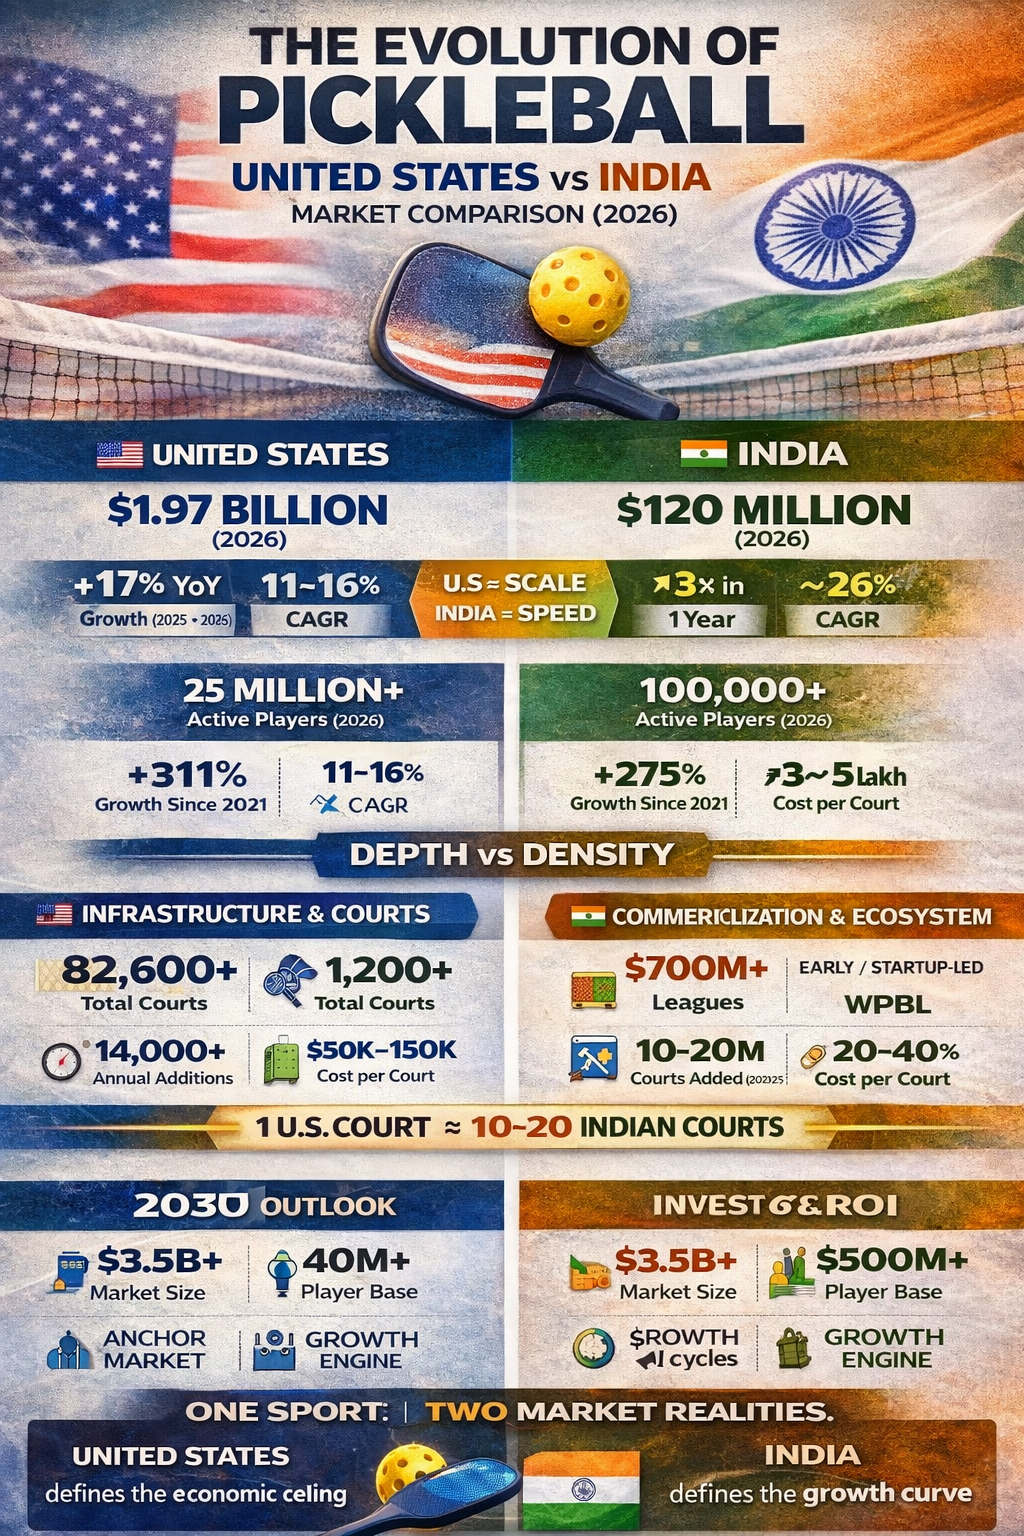
In 2026, the United States pickleball market is valued at approximately USD 1.97 billion, making it the undisputed global leader. This represents an increase from USD 1.69 billion in 2025, reflecting a year-on-year growth of nearly 17%. The U.S. market has maintained a compound annual growth rate (CAGR) of 11–16% between 2024 and 2029, driven by equipment sales, professional leagues, facility memberships, sponsorships, and media rights.
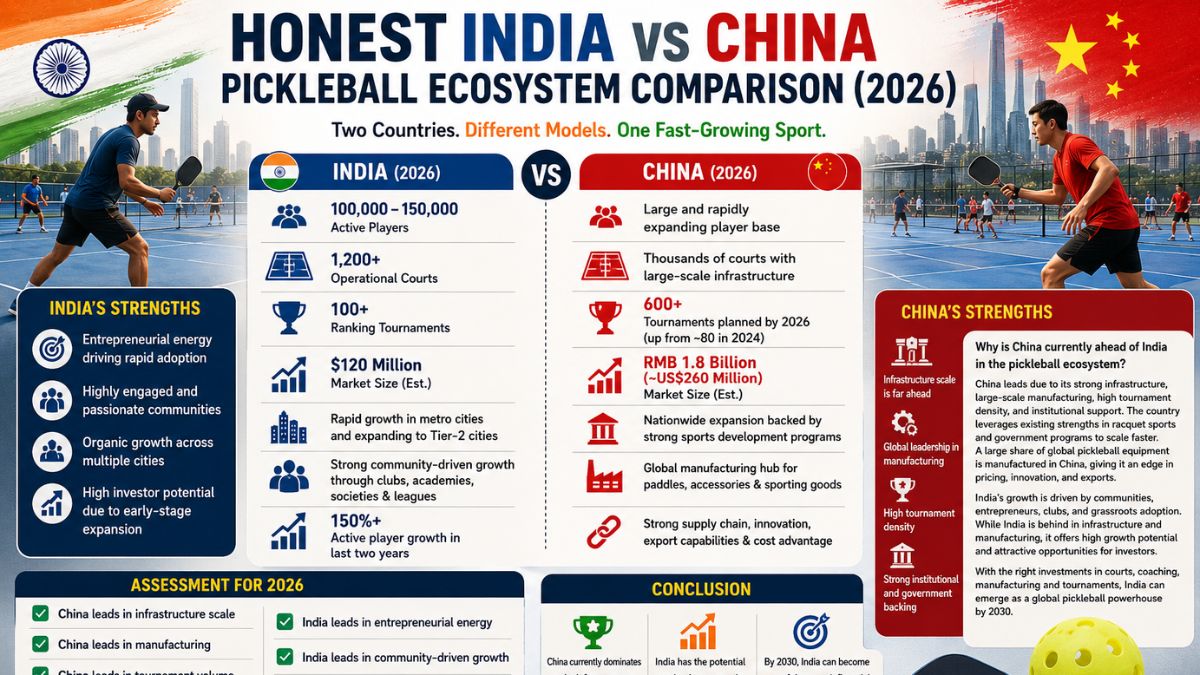
In contrast, India’s pickleball market is valued at roughly USD 120 million in 2026, up sharply from USD 40 million in 2025. While the absolute size is nearly 16 times smaller than the U.S., India’s CAGR of approximately 26% positions it among the fastest-growing pickleball markets globally. Projections indicate India could reach USD 500 million by 2030, representing more than 4x growth in four years.
The U.S. market is scale-driven; India is trajectory-driven.
Player Participation and Demographic Penetration
Player participation remains the strongest indicator of market sustainability. In 2026, the United States has an estimated 25 million active pickleball players, compared to fewer than 8 million in 2021—representing an extraordinary 311% increase over five years. The U.S. market benefits from deep demographic penetration, spanning seniors (55+), Gen X, millennials, and an increasingly active Gen Z cohort.
India, while still nascent, has crossed 100,000 active players in 2026, up from fewer than 30,000 in 2021—reflecting 275% growth. Participation is heavily concentrated in urban metros and Tier-2 cities, with the strongest adoption among urban youth, working professionals, gated communities, and families. Youth and school-level participation remains early-stage but is accelerating rapidly.
The U.S. enjoys scale and diversity; India benefits from demographic concentration and faster onboarding.
Infrastructure and Court Economics
Infrastructure remains a defining contrast between the two markets. By 2026, the United States hosts over 82,600 pickleball courts across 18,258 locations, adding more than 14,000 courts annually. However, infrastructure expansion faces rising costs, zoning challenges, and space constraints. The cost per court ranges from USD 50,000 to USD 150,000, depending on indoor or outdoor formats.
India, by comparison, has approximately 1,200 courts across 250 locations, but the cost per court is significantly lower—between INR 3–5 lakh (USD 3,500–6,000). Between 2024 and 2026 alone, India added more than 1,000 courts, driven by housing societies, private academies, and community spaces. By 2030, India is projected to require 2,500+ courts to meet participation demand.
The U.S. faces infrastructure saturation risk; India enjoys low-cost, scalable expansion.
Commercialization and Business Ecosystem
Commercial maturity defines the U.S. pickleball ecosystem. Major brands such as Nike, Selkirk, JOOLA, and Franklin Sports dominate equipment and apparel, while professional leagues like Major League Pickleball (MLP) and the Professional Pickleball Association (PPA) attract sponsorships, broadcast deals, and franchise valuations in excess of USD 10–20 million per team.
India’s ecosystem, by contrast, is startup-led and innovation-driven. Brands such as Picklebay and Serve Club are building grassroots infrastructure, coaching networks, and digital platforms. India’s primary professional initiative, the World Pickleball League (WPBL), remains early-stage but is already attracting corporate sponsors and celebrity investors.
Facility profit margins in India are estimated at 20–40%, higher than the 15–35% margins typical in the U.S., largely due to lower capital expenditure and operating costs.
Investment and ROI Dynamics
Investment profiles differ sharply. In the U.S., pickleball investments are capital-intensive, focused on large indoor facilities, league franchises, and technology-enabled performance platforms. ROI timelines are typically medium-term, with greater emphasis on operational efficiency and scale optimization.
India offers low-capex, high-velocity opportunities, particularly in courts, coaching academies, leagues, and sponsorship aggregation. ROI timelines are shorter, but risks remain around adoption consistency and ecosystem fragmentation. India currently represents a seed- to early-stage investment market, while the U.S. operates firmly in the growth-to-maturity phase.
Long-Term Outlook and Strategic Positioning
By 2030, the U.S. pickleball market is projected to exceed USD 3.5 billion, with a player base surpassing 40 million. Strategic focus will shift toward youth pipelines, collegiate programs, and international expansion.
India, meanwhile, is expected to reach 1 million players and USD 500 million in market value, positioning itself as the global growth engine for pickleball. Sponsorship-driven leagues, geographic expansion beyond metros, and integration into school sports systems will define the next phase.
Final Takeaways
The United States represents stability, monetization, and global leadership in pickleball. India represents speed, scalability, and future dominance in growth metrics. For investors, brands, and federations, the optimal strategy lies not in choosing one market over the other—but in leveraging U.S. maturity to fund Indian expansion, while using India’s growth to fuel the next global wave of pickleball.
In 2026, pickleball is no longer just a sport—it is a global sports economy in motion, with the U.S. as its anchor and India as its accelerator.
Pickleball Market Comparison (2026): United States vs India
| Category | United States | India |
|---|---|---|
| Market Stage | Mature, capital-rich, commercially optimized | Emerging, high-growth, adoption-driven |
| Market Value (2026) | USD 1.97 billion | USD 120 million |
| Market Value (2025) | USD 1.69 billion | USD 40 million |
| Year-on-Year Growth (2025–26) | ~17% | ~200% |
| CAGR | 11–16% (2024–2029) | ~26% |
| Projected Market Size (2030) | USD 3.5+ billion | USD 500 million |
| Growth Nature | Scale-driven | Trajectory-driven |
Player Participation & Demographics
| Metric | United States | India |
|---|---|---|
| Active Players (2026) | 25 million | 100,000+ |
| Active Players (2021) | < 8 million | < 30,000 |
| Growth (2021–2026) | 311% | 275% |
| Demographic Spread | Seniors, Gen X, Millennials, Gen Z | Urban youth, professionals, families |
| Youth / School Penetration | Established & expanding | Early-stage, accelerating |
| Geographic Spread | Nationwide | Metros & Tier-2 cities |
Infrastructure & Court Economics
| Metric | United States | India |
|---|---|---|
| Total Courts (2026) | 82,600+ | ~1,200 |
| Total Locations | 18,258 | ~250 |
| Courts Added Annually | 14,000+ | Rapid expansion since 2024 |
| Cost per Court | USD 50,000–150,000 | INR 3–5 lakh (USD 3,500–6,000) |
| Infrastructure Challenges | Zoning, space constraints, high capex | Minimal; low-cost scalability |
| Projected Court Requirement (2030) | Saturation risk | 2,500+ courts needed |
Commercialization & Ecosystem Maturity
| Aspect | United States | India |
|---|---|---|
| Ecosystem Type | Brand- and league-driven | Startup- and innovation-led |
| Major Brands | Nike, Selkirk, JOOLA, Franklin | Picklebay, Serve Club (emerging) |
| Professional Leagues | MLP, PPA | World Pickleball League (WPBL) |
| Franchise Valuation | USD 10–20 million+ | Early-stage |
| Revenue Streams | Media rights, sponsorships, memberships | Sponsorships, academies, platforms |
| Facility Profit Margins | 15–35% | 20–40% |
Investment & ROI Dynamics
| Metric | United States | India |
|---|---|---|
| Investment Nature | Capital-intensive | Low-capex |
| Focus Areas | Indoor facilities, franchises, tech | Courts, coaching, leagues, sponsorship |
| Investment Stage | Growth to maturity | Seed to early-stage |
| ROI Timeline | Medium-term | Shorter-term |
| Risk Profile | Lower risk, slower upside | Higher risk, faster upside |
Long-Term Outlook (2030)
| Metric | United States | India |
|---|---|---|
| Projected Players | 40+ million | 1 million |
| Strategic Focus | Youth pipelines, collegiate play, global expansion | School integration, metro-to-tier expansion |
| Global Role | Market anchor & monetization hub | Global growth engine |
| Primary Advantage | Stability & leadership | Speed & scalability |
| Dimension | United States | India |
|---|---|---|
| Core Strength | Monetization & infrastructure depth | Adoption velocity & low-cost growth |
| Market Risk | Infrastructure saturation | Ecosystem fragmentation |
| Best Use Case | Revenue stability & global branding | Rapid expansion & future scale |